|
Peremennye Zvezdy (Variable Stars) 44, No. 2, 2024 Received 15 March; accepted 12 April. |
Article in PDF |
|
DOI: 10.24412/2221-0474-2024-44-6-27
|
Seven New Multiperiodic δ Scuti stars in Cygnus
A. Samokhvalov
Surgut, Russia, e-mail: sav@surgut.ru
| In a small field in Cygnus, I discovered seven new DSCTC stars that demonstrate multiperiodic pulsations from V-band CCD observations. For each of these stars, from two to four reliable pulsation frequencies could be derived. The paper presents finding charts, frequency spectra, light curves for program stars. New high-quality multi-band observations of the discovered variable stars with larger telescopes are needed. |
1. Introduction
Working on our program aimed at discoveries and studies of DSCT-type stars, we have discovered seven new DSCTC stars with signs of multiperiodic pulsations in a field in Cygnus. The main information about these stars is presented in Table 1. Their coordinates were drawn from the Gaia DR3 catalog (Gaia Collaboration, 2022). None of these stars are currently contained in the General Catalogue of Variable Stars (GCVS), see Samus et al. (2017), or in the AAVSO Variable Star Index (VSX), see Watson et al. (2006). However, they are marked VARIABLE in the Gaia DR3 catalog, see Gaia Data Release 3 (Gaia DR3), Variability (Eier et al., 2023). Infrared color indices were drawn from 2MASS catalogue (Cutri et al., 2003).
Table 1. New Variable Stars
| No. | USNO-A2.0 | RA, J2000.0 | Dec, J2000.0 | V | J – H | H – K | J – K |
| 1 | 1425-12331125 |
|
|
|
|
|
|
| 2 | 1425-12332333 |
|
|
|
|
|
|
| 3 | 1425-12344159 |
|
|
|
|
|
|
| 4 | 1425-12354548 |
|
|
|
|
|
|
| 5 | 1425-12372223 |
|
|
|
|
|
|
| 6 | 1425-12374410 |
|
|
|
|
|
|
| 7 | 1425-12377701 |
|
|
|
|
|
|
Based on VSX and 2MASS catalogs, we plot a population distribution
diagram of DSCT stars (DSCT, DSCTC, and HADS-type stars) as a
function of infrared colors, derived from 2MASS photometry
(Fig. 1). Only stars with good 2MASS photometry (![]() ) and
reliably defined variability types (without an uncertainty symbol
":" in VSX Type) are used. All the new variable stars reported
here also possess the 2MASS quality flag
) and
reliably defined variability types (without an uncertainty symbol
":" in VSX Type) are used. All the new variable stars reported
here also possess the 2MASS quality flag ![]() . The new
variable stars are located in this diagram near the
maximum-density population core, in the green and blue zones. This
position can be considered one of the signs of belonging to the
DSCT variability type.
. The new
variable stars are located in this diagram near the
maximum-density population core, in the green and blue zones. This
position can be considered one of the signs of belonging to the
DSCT variability type.
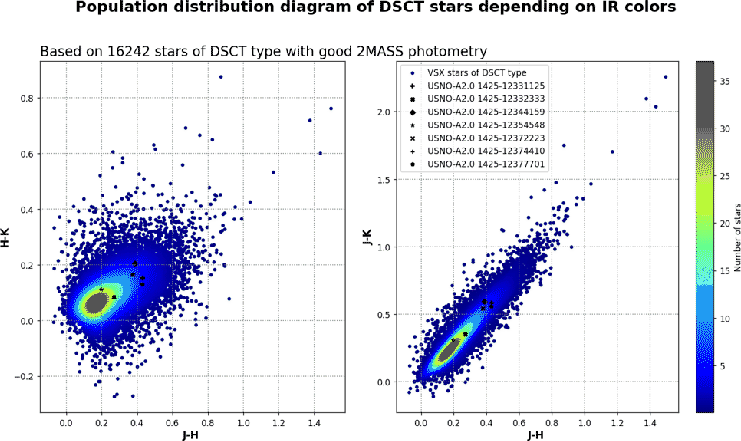 |
Fig. 1.
Population distribution diagram of DSCT
stars as a function of 2MASS infrared colors |
2. Observations, primary reduction and magnitude calibration
Our observations were carried out at the Caucasian Mountain Observatory (CMO) of M.V. Lomonosov Moscow State University (Shatsky et al., 2020) using the 0.25-m remote-controlled Ritchey-Chretien telescope, equipped with a SBIG STXL-6303e CCD Camera and a
Table 2. Images taken on each observing night
| HJD | Images | HJD | Images | HJD | Images | HJD | Images | HJD | Images |
| 2460187 | 12 | 2460211 | 27 | 2460237 | 33 | 2460259 | 33 | 2460302 | 4 |
| 2460188 | 9 | 2460212 | 4 | 2460238 | 30 | 2460261 | 13 | 2460308 | 23 |
| 2460189 | 15 | 2460216 | 25 | 2460240 | 29 | 2460275 | 5 | 2460309 | 6 |
| 2460190 | 14 | 2460218 | 32 | 2460246 | 21 | 2460277 | 31 | 2460310 | 9 |
| 2460198 | 22 | 2460223 | 9 | 2460248 | 35 | 2460281 | 37 | 2460311 | 21 |
| 2460202 | 18 | 2460225 | 33 | 2460249 | 32 | 2460282 | 15 | 2460314 | 14 |
| 2460203 | 16 | 2460226 | 6 | 2460250 | 19 | 2460283 | 36 | 2460316 | 18 |
| 2460207 | 23 | 2460230 | 30 | 2460253 | 31 | 2460286 | 5 | 2460320 | 22 |
| 2460208 | 25 | 2460231 | 30 | 2460254 | 15 | 2460287 | 5 | 2460321 | 21 |
| 2460209 | 26 | 2460232 | 30 | 2460256 | 12 | 2460298 | 28 | 2460325 | 17 |
| 2460210 | 28 | 2460233 | 30 | 2460257 | 11 | 2460299 | 25 |
For basic reductions for dark current, flat fields, and bias, and in order to remove hot pixels and cosmic rays hits, we used IRAF routines and proprietary software TheSkyXTMby Software Bisque Inc. For calibration, each observing night we obtained 16 bias frames, 16 dark frames, 16 flat fields, plus 16 dark frames corresponding to flat fields.
For photometry of new pulsating stars, we applied VaST software by Sokolovsky and Lebedev (2018). All times in this paper are expressed in terrestrial time in accordance with IAU recommendations (resolution B1 XXIII IAU GA), with heliocentric corrections applied.
For magnitude calibration in the ![]() band, we use data of the GAIA
DR3 catalogue. We restrict ourselves to single, relatively bright
stars, with no saturation of pixels for our CCD camera, no close
neighbors, and demonstrating no brightness variations during the
time interval of our observations. Detailed information about our
calibration stars is collected in Table 3. Uncertainties in the
band, we use data of the GAIA
DR3 catalogue. We restrict ourselves to single, relatively bright
stars, with no saturation of pixels for our CCD camera, no close
neighbors, and demonstrating no brightness variations during the
time interval of our observations. Detailed information about our
calibration stars is collected in Table 3. Uncertainties in the
![]() column were derived from our photometry, the GAIA
column were derived from our photometry, the GAIA ![]() ,
,
![]() , and
, and ![]() magnitudes were drawn from the
corresponding catalog. Magnitudes in the "Calc.
magnitudes were drawn from the
corresponding catalog. Magnitudes in the "Calc. ![]() " column were
obtained using the equation:
" column were
obtained using the equation:
| (1) |
which is based on table 5.9 of the Gaia Data Release 3, Documentation release 1.2
(https://gea.esac.esa.int/archive/documentation/GDR3/)
Table 3. Magnitudes of calibration stars
| GSC | σV | GAIA | Calc. V | ||
| G | GBP | GRP | |||
| 3968-2621 | 0.008 | 11.5102 | 12.5060 | 10.5323 | 12.2394 |
| 3968-3272 | 0.007 | 12.1790 | 12.5445 | 11.6340 | 12.3610 |
| 3968-3000 | 0.008 | 12.3394 | 12.5281 | 12.0156 | 12.4139 |
| 3968-2894 | 0.007 | 12.0446 | 12.3314 | 11.5923 | 12.1732 |
| 3968-2595 | 0.007 | 11.8378 | 12.1974 | 11.3031 | 12.0143 |
| 3968-2517 | 0.007 | 12.0227 | 12.2059 | 11.7003 | 12.0958 |
The observations are presented as a zip archive in the html version of this paper.
3. Results
To derive periods, we use Period04 software by Lenz and Breger (2005) that implements the discrete Fourier transform, very suitable for analysis of sine-shaped light curves of the pulsating variable stars with multiperiodicity.
We searched for periodic signals in our observations in the
frequency range between 3 and 20 cycles per day that was selected
following recommendations by Breger (2000). We continuously
calculate significant frequencies, in the first iteration based on
the original data, in the following iterations, using residuals
instead, as long as the signal-to-noise ratio for the
corresponding peak in the Fourier frequency spectrum exceeds 4.
This is the empirical criterium obtained from the analysis of
observations by Breger et al. (1993) and ensuring that the signal
is a real feature. Parameters of the oscillations corresponding to
the equation
| (2) |
For plotting light curves, Fourier spectra, and population distribution diagram, we used our own routines written in Python 3 programming language using the NumPy (Harris et al., 2020) and Matplotlib (Hunter, 2007) libraries.
Table 4. Detected frequencies of the new pulsating variable
stars
| USNO A2.0 | N | merror | mmean | Oscillations | ||||
| Freqi | Frequency, d-1 | Φi | Ai, mag | SNR | ||||
| 1425-12331125 | 986 | 0.012 | 15.4382 | f1 | 7.17082 | 0.11158 | 0.0213 | 23.48 |
| f2 | 8.46182 | 0.33195 | 0.0042 | 4.80 | ||||
| 1425-12332333 | 1051 | 0.0018 | 12.3762 | f1 | 5.841265 | 0.28593 | 0.0123 | 26.98 |
| f2 | 5.503670 | 0.91417 | 0.0060 | 12.73 | ||||
| f3 | 7.543690 | 0.55110 | 0.0039 | 10.27 | ||||
| f4 | 6.930815 | 0.05636 | 0.0031 | 7.91 | ||||
| 1425-12344159 | 1054 | 0.013 | 15.5964 | f1 | 11.349167 | 0.16114 | 0.0173 | 15.00 |
| f2 | 6.429910 | 0.95664 | 0.0163 | 12.13 | ||||
| f3 | 11.116893 | 0.30195 | 0.0104 | 8.99 | ||||
| f4 | 11.034570 | 0.09757 | 0.0066 | 5.63 | ||||
| 1425-12354548 | 1057 | 0.0033 | 13.5234 | f1 | 17.932155 | 0.85287 | 0.0107 | 30.26 |
| f2 | 18.073310 | 0.02408 | 0.0037 | 10.46 | ||||
| f3 | 13.329770 | 0.57958 | 0.0019 | 5.45 | ||||
| f4 | 14.873727 | 0.49255 | 0.0018 | 5.13 | ||||
| 1425-12372223 | 1059 | 0.0156 | 15.8190 | f1 | 8.979444 | 0.15165 | 0.0285 | 23.99 |
| f2 | 8.713564 | 0.07668 | 0.0270 | 22.54 | ||||
| f3 | 9.410159 | 0.43088 | 0.0196 | 16.52 | ||||
| f4 | 17.201639 | 0.96931 | 0.0085 | 7.70 | ||||
| 1425-12374410 | 1058 | 0.0054 | 14.3492 | f1 | 12.666880 | 0.58088 | 0.0159 | 21.03 |
| f2 | 12.963420 | 0.33383 | 0.0084 | 10.76 | ||||
| 1425-12377701 | 1054 | 0.0097 | 15.2028 | f1 | 17.573930 | 0.13065 | 0.0159 | 24.92 |
| f2 | 14.945790 | 0.93866 | 0.0080 | 10.64 | ||||
| f3 | 14.717230 | 0.02628 | 0.0045 | 5.92 | ||||
Our observations are available as a zip archive in the html version of this paper.
3.1. USNO-A2.0 1425-12331125
This is the faintest star in our sample, and we found only two significant frequencies for it. The second frequency has a very small amplitude and is very close to the lower reliability boundary, with theFigure 2 presents the frequency spectrum of USNO-A2.0 1425-12331125 and its theoretical light curve (solid curve) with superposed data points corresponding to individual observations.
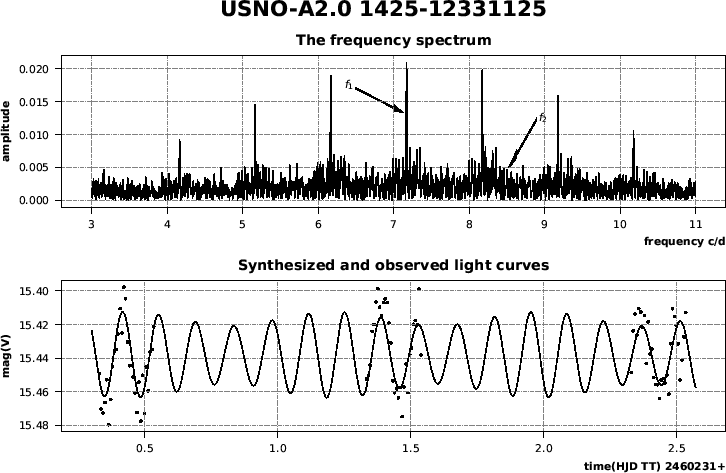 |
Fig. 2. The frequency spectrum and light curve of USNO-A2.0 1425-12331125. In the bottom panel, the solid curve is the synthesized light curve and dots are observed data points. |
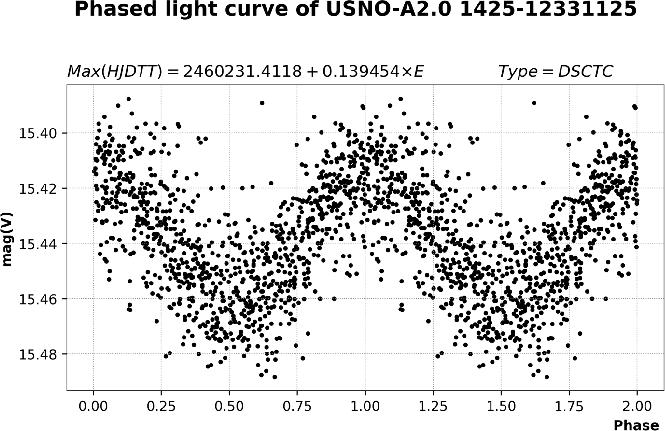
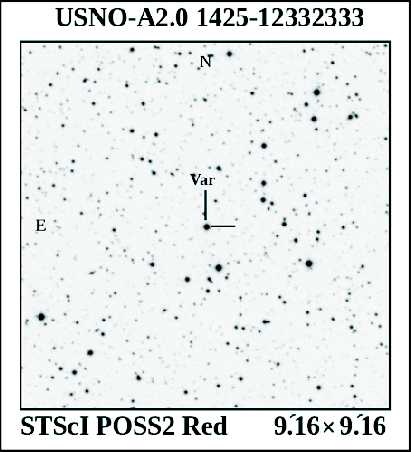
The finding chart based on a POSS2 red plate is presented in Fig. 3.

The ![]() -band phased light curve of USNO-A2.0 1425-12331125 with
the following light elements:
-band phased light curve of USNO-A2.0 1425-12331125 with
the following light elements:
is presented in Fig. 4.
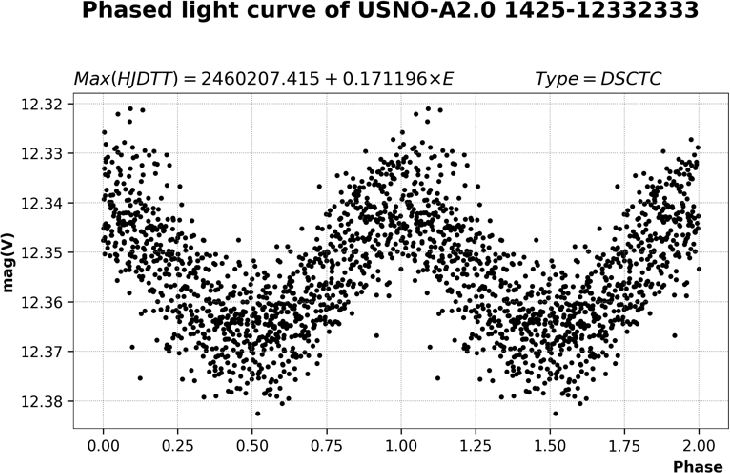
3.2. USNO-A2.0 1425-12332333
Figure 5 presents the frequency spectrum of USNO-A2.0 1425-12332333 and its theoretical light curve (solid curve) with superposed data points corresponding to individual observations. Light curve variations are easy to notice, they are reproduced with the model rather well.
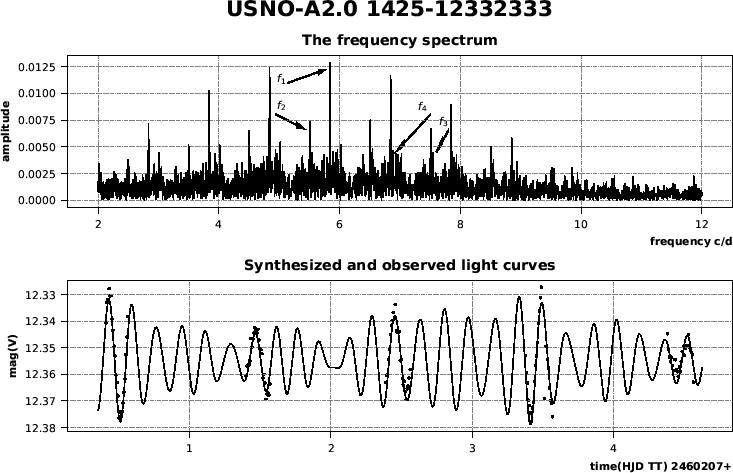 |
Fig. 5. The frequency spectrum and light curve of USNO-A2.0 1425-12332333. In the bottom panel, the solid curve is the synthesized light curve and dots are observed data points. |
The finding chart based on a POSS2 red plate is presented in Fig. 6.
The phased ![]() -band light curve of USNO-A2.0 1425-12332333 with
the following light elements:
-band light curve of USNO-A2.0 1425-12332333 with
the following light elements:
is presented in Fig. 7.
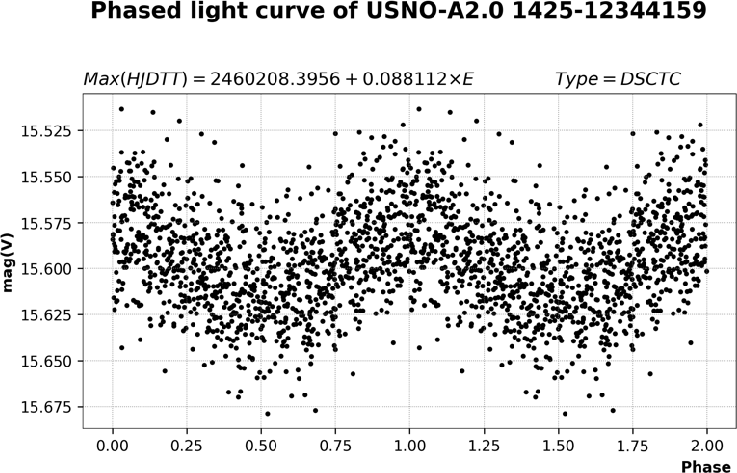
3.3. USNO-A2.0 1425-12344159
The frequency spectrum of USNO-A2.0 1425-12344159 and its theoretical light curve (solid curve) with superposed data points corresponding to individual observations are given in Fig. 8. Light curve variations are easy to notice, they are reproduced with the model rather well.
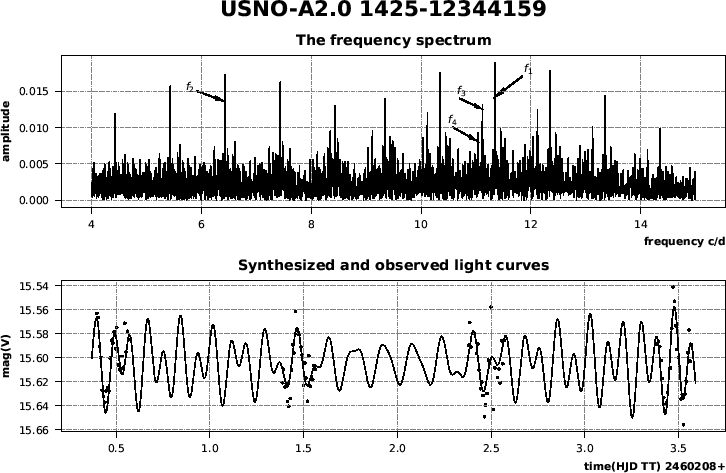 |
Fig. 8. The frequency spectrum and light curve of USNO-A2.0 1425-12344159. In the bottom panel, the solid curve is the synthesized light curve and dots are observed data points. |
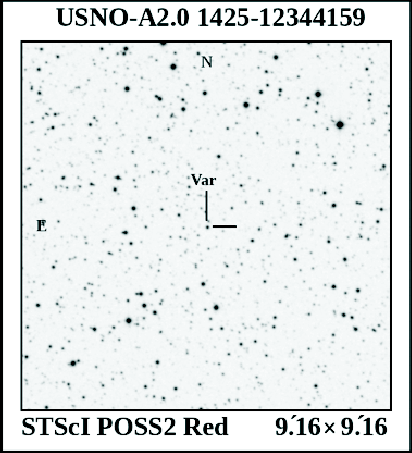
The finding chart based on a POSS2 red plate is presented in Fig. 9.
The phased ![]() -band light curve of USNO-A2.0 1425-12344159 with
the following light elements:
-band light curve of USNO-A2.0 1425-12344159 with
the following light elements:
is presented in Fig. 10.
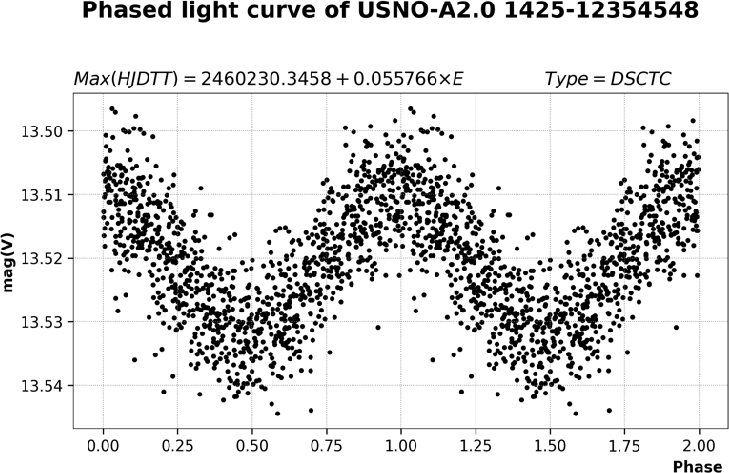
3.4. USNO-A2.0 1425-12354548
Figure 11 presents the frequency spectrum of USNO-A2.0 1425-12354548 and its theoretical light curve (solid curve) with superposed data points corresponding to individual observations.
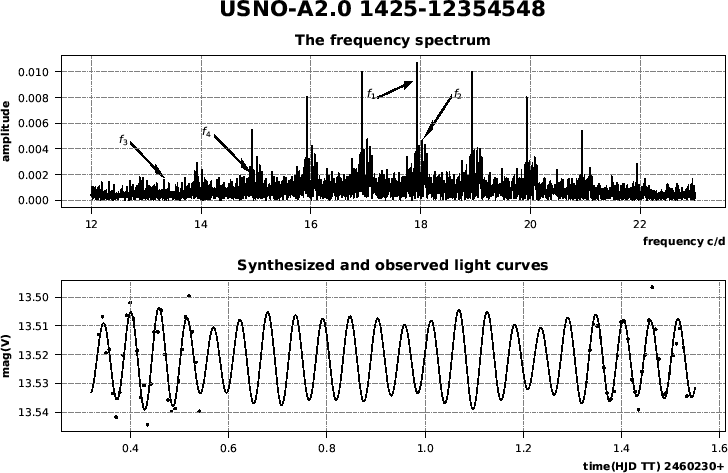 |
Fig. 11. The frequency spectrum and light curve of USNO-A2.0 1425-12354548. In the bottom panel, the solid curve is the synthesized light curve and dots are observed data points. |
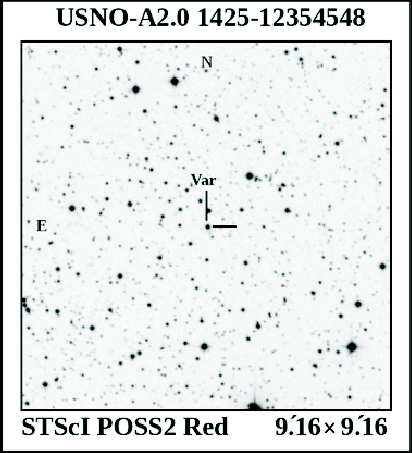
The finding chart based on a POSS2 red plate is presented in Fig. 12.
The phased ![]() -band light curve of USNO-A2.0 1425-12354548 with
the following light elements:
-band light curve of USNO-A2.0 1425-12354548 with
the following light elements:
is presented in Fig. 13.
3.5. USNO-A2.0 1425-12372223
Figure 14 presents the frequency spectrum of USNO-A2.0 1425-12372223 and its theoretical light curve (solid curve) with superposed data points corresponding to individual observations.
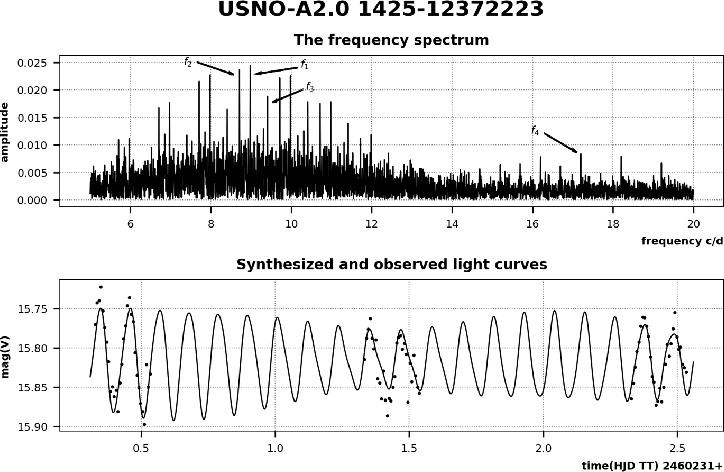 |
Fig. 14. Frequency spectrum and light curve of USNO-A2.0 1425-12372223. In the bottom panel, the solid curve is the synthesized light curve and dots are observed data points. |
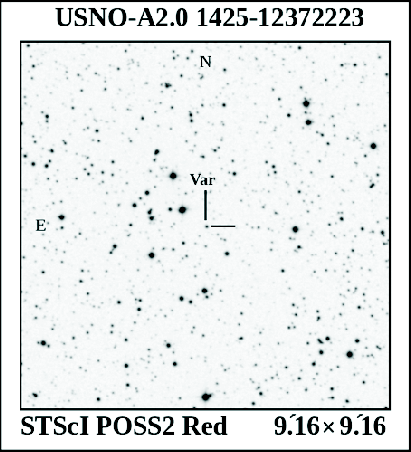
The finding chart based on a POSS2 red plate is presented in Fig. 15.
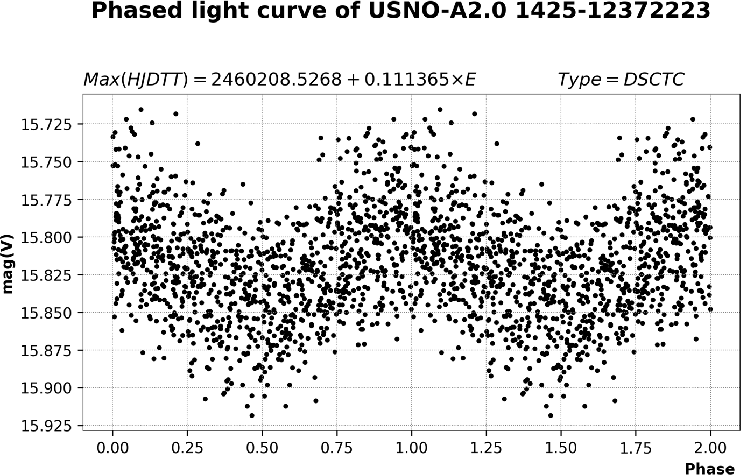
The ![]() -band phased light curve of USNO-A2.0 1425-12372223 with
the following light elements:
-band phased light curve of USNO-A2.0 1425-12372223 with
the following light elements:
is presented in Fig. 16.
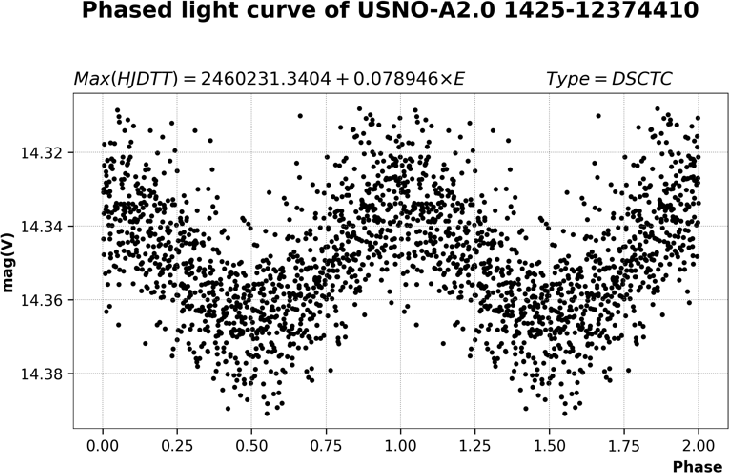
3.6. USNO-A2.0 1425-12374410
Figure 17 presents the frequency spectrum of USNO-A2.0 1425-12374410 and its theoretical light curve (solid curve) with superposed data points corresponding to individual observations.
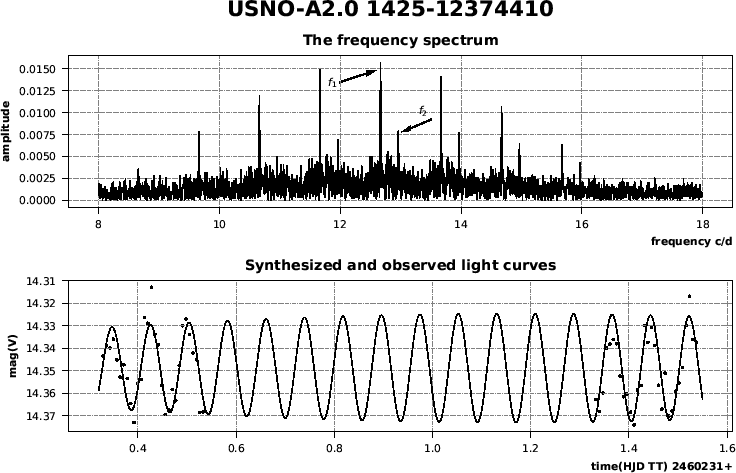 |
Fig. 17. The frequency spectrum and light curve of USNO-A2.0 1425-12374410. In the bottom panel, the solid curve is the synthesized light curve and dots are observed data points. |
The finding chart based on a POSS2 red plate is presented in Fig. 18.
The phased ![]() -band light curve of USNO-A2.0 1425-12374410 with
the following light elements:
-band light curve of USNO-A2.0 1425-12374410 with
the following light elements:
is presented in Fig. 19.
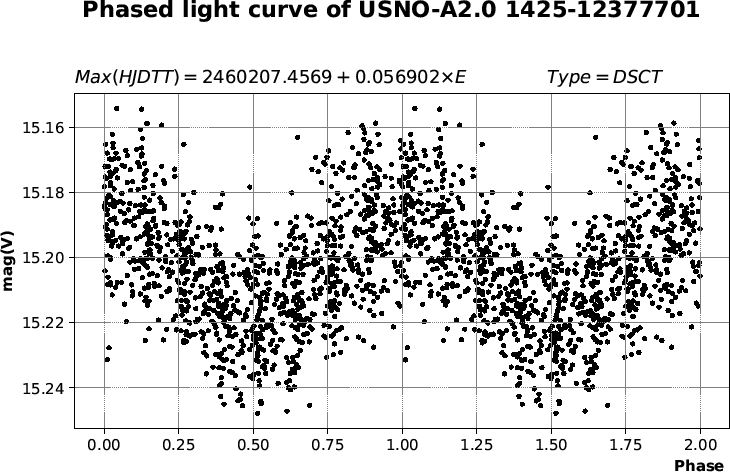
3.7. USNO-A2.0 1425-12377701
Figure 20 presents the frequency spectrum of USNO-A2.0 1425-12377701 and its theoretical light curve (solid curve) with superposed data points corresponding to individual observations.
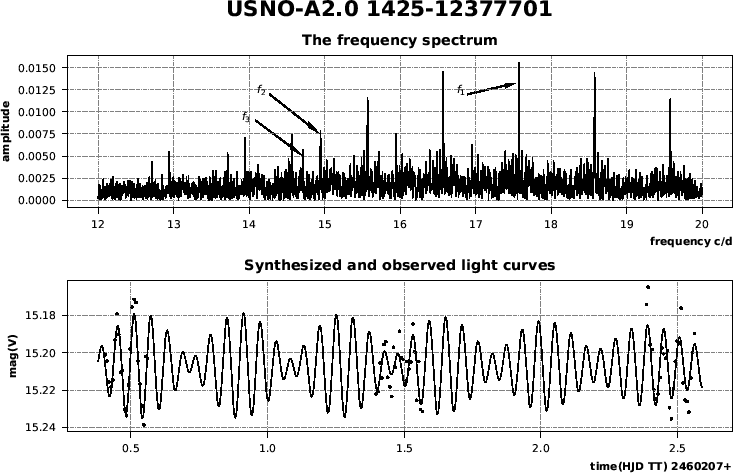 |
Fig. 20. The frequency spectrum and light curve of USNO-A2.0 1425-12377701. In the bottom panel, the solid curve is the synthesized light curve and dots are observed data points. |
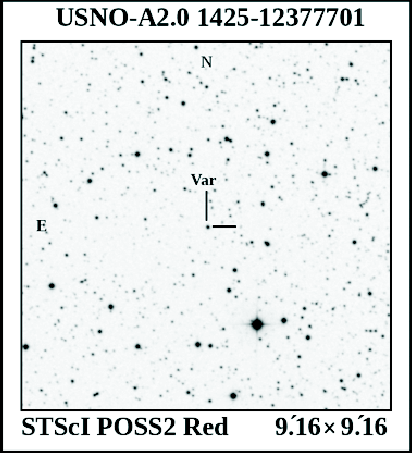
The finding chart based on a POSS2 red plate is presented in Fig. 21.
The phased ![]() -band light curve of USNO-A2.0 1425-12377701 with
the following light elements:
-band light curve of USNO-A2.0 1425-12377701 with
the following light elements:
is presented in Figure 22.
4. Conclusion
We have found seven new pulsating DSCTC stars with reliable signs of multiperiodic pulsations. All detected frequencies correspond to reliable oscillations.
The fact that the studied seven DSCTC stars are located in a small field (0.42 square degrees) is a good reason to continue the search for stars with similar pulsation properties at low galactic latitudes, in adjacent star fields.
In order to check for the presence of possible additional frequencies and to verify pulsation mode identification, new precision photometry in several standard photometric bands is needed. We appeal to observers having access to large telescopes to continue observations of these interesting variable stars.
Acknowledgements: I would like to thank Prof. N. N. Samus for helpful discussion and the anonymous referee for suggested improvements of the manuscript.
References:
Breger, M., 2000, ASP Conference Series, 210, 3
Breger, M., Stich, J., Garrido, R., et al., 1993, Astron. & Astrophys., 271, 482
Cutri, R. M., Skrutskie, M. F., van Dyk, S., et al., 2003, 2MASS All Sky Catalog of Point Sources, Centre de Données Astronomiques de Strasbourg, II/246
Eier, L., Audard, M., Holl, B., et al. 2023, Astron. & Astrophys., 674, article id. A13
Hunter, J. D., 2007, Computing in Science & Engineering, 9, No. 3, 90
Harris, C. R., Millman, K. J., van der Walt, S. J., et al., 2020, Nature, 585, 357
Lenz, P. & Breger, M. 2005, Communications in Asteroseismology, 146, 53
Monet, D., Bird, A., Canzian, B., et al., 1998, USNO-A V2.0, A Catalog of Astrometric Standards, Centre de Données Astronomiques de Strasbourg, I/252
Samus, N. N., Kazarovets, E. V., Durlevich, O. V., Kireeva, N. N., Pastukhova, E. N., 2017, Astron. Reports, 61, 80
Shatsky, N., Belinski, A., Dodin, A., et al., 2020, in Ground-Based Astronomy in Russia. 21st Century, ed. I. I. Romanyuk, I. A. Yakunin, A. F. Valeev, & D. O. Kudryavtsev, p. 127
Sokolovsky, K. V. & Lebedev, A. A., 2018, Astron. and Computing, 22, 28
Watson, C. L., Henden, A. A., & Price, A., 2007, Journal of the AAVSO, 35, 414