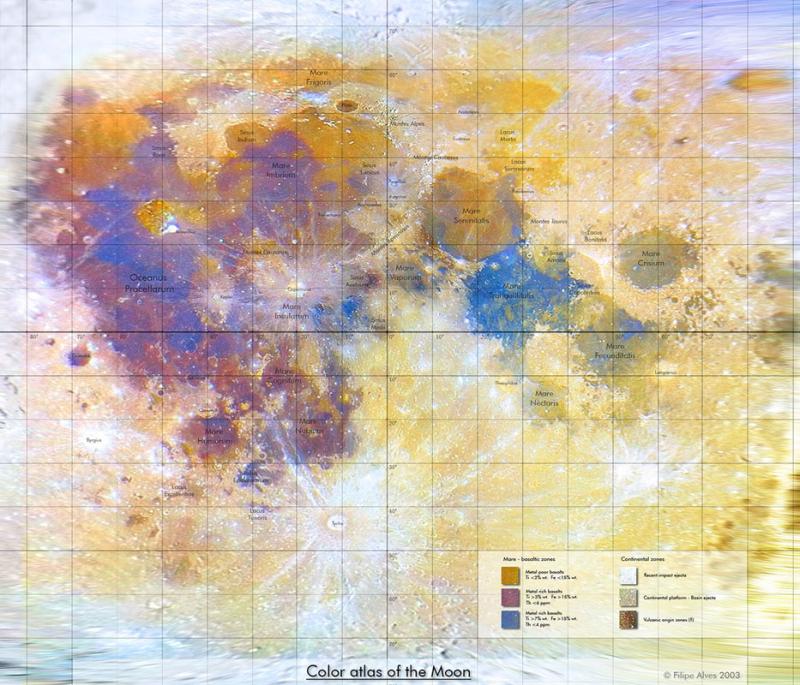
The Jan 28 LPOD astonished many observers with its detailed color rendition of the Full Moon. Now that imager, Filipe Alves, has used advanced computer manipulation to create a Mercator-like projection color image of the Moon - the first I know of. This is a level of sophistication that is new to amateur Moon mapping. Here is what the color key at the bottom right says. Left column: Mare- basaltic zones: top gold button = metal poor basalts Ti <2% wt, Fe <15%. Second purple button = metal rich basalts Ti >3%, Fe >15%, Th <6 ppm. Third blue button = metal rich basalts Ti >7%, Fe >15%, Th <4 ppm. The right hand column is labeled Continental zones: top white button = recent impact ejecta, 2nd gray button: continental platform - basin ejecta. Bottom brown button = volcanic origin zones (?). Knowing the difficulty that professional astronomers have in calibrating their images to derive elemental abundances I assume that Filipe has simply calibrated his image against published images such as the map made from the Galileo flyby. Click the image above for a larger view of Filipe's wonderful map.
Originally posted March 7, 2004
Related Links:
UV Projections
|
Yanvar' Fevral' Mart Aprel' Mai Iyun' Iyul' Avgust Sentyabr' Oktyabr' Noyabr' Dekabr' |
|
Publikacii s klyuchevymi slovami:
Moon - Luna - Lunar Photo of the Day - LPOD
Publikacii so slovami: Moon - Luna - Lunar Photo of the Day - LPOD | |
Sm. takzhe:
Vse publikacii na tu zhe temu >> | |
