Credit & Copyright: Alan Friedman
(Averted Imagination)
Explanation:
Where have all the sunspots gone?
Last month the total number of spots that crossed our Sun was ...
zero.
Well below of the long term monthly average,
the Sun's surface has become as unusually passive this
solar minimum just like it did 11 years ago during the
last solar minimum.
Such passivity is not just a
visual spectacle, it correlates with the
Sun
being
slightly dimmer, with
holes in the
Sun's corona being more stable, and with a reduced intensity
in the outflowing solar wind.
The reduced wind, in turn, cools and
collapses Earth's outer atmosphere (the
thermosphere),
causing reduced drag on many Earth-orbiting satellites.
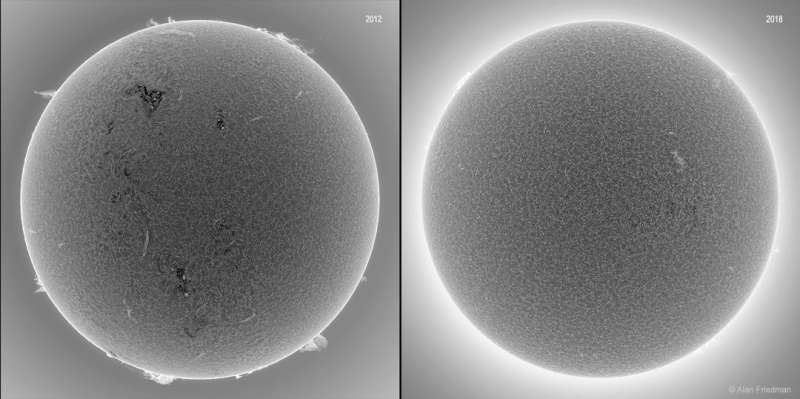
Pictured in inverted black & white on the left,
the Sun's busy surface is shown near
solar maximum in 2012,
in contrast to the image on the right,
which shows the Sun's surface last August,
already without spots (for a few days), as
solar minimum was setting in.
Effects of this unusually static solar minimum are
being studied.
1999 2000 2001 2002 2003 2004 2005 2006 2007 2008 2009 2010 2011 2012 2013 2014 2015 2016 2017 2018 2019 2020 2021 2022 2023 2024 2025 |
Yanvar' Fevral' Mart Aprel' Mai Iyun' Iyul' Avgust Sentyabr' Oktyabr' Noyabr' Dekabr' |
NASA Web Site Statements, Warnings, and Disclaimers
NASA Official: Jay Norris. Specific rights apply.
A service of: LHEA at NASA / GSFC
& Michigan Tech. U.
|
Publikacii s klyuchevymi slovami:
Sun - sunspot - Solnce - Solnechnye pyatna - solnechnyi cikl
Publikacii so slovami: Sun - sunspot - Solnce - Solnechnye pyatna - solnechnyi cikl | |
Sm. takzhe:
Vse publikacii na tu zhe temu >> | |
