| Article in PDF |
"Peremennye Zvezdy", Prilozhenie, vol. 8, N 46 (2008) |
BX Scl: a Stable Single-Mode Field SX Phoenicis Type Star
P. Pereira, J. M. Santos-Junior
Diretoria de Astronomia, Fundação Planetário da Cidade do Rio
de Janeiro, Brazil
| ISSN 2221–0474 |
Received: 18.11.2008; accepted: 25.11.2008
(E-mail for contact: pcpereira@rio.rj.gov.br)
| ||||||||||||||||||||||
Remarks: |
| SX Phoenicis (SXPHE) stars are short-period pulsating stars of Population II, with
spectral types ranging from A to F. They have low metal abundances, high spatial
velocities,
and space distributions typical of old and halo stars. See, for example, Breger (2000)
for a review about SX Phe stars. Preston and Landolt (1998) found, by photometry
and
spectroscopy, a pulsational period of P = 0.037 day for BX Scl. In order to confirm
this value,
the presence of addtional periods and/or harmonics, we started the monitoring of
BX Scl
in 2007.
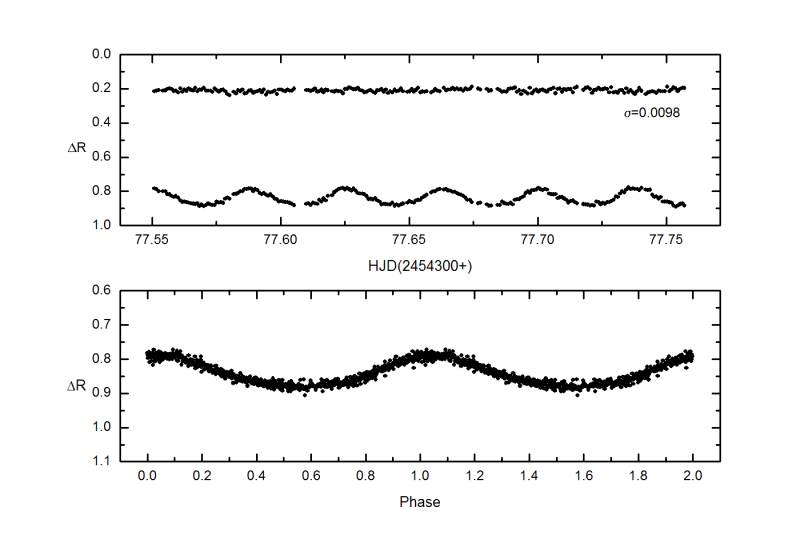
BX Scl was observed in 2007 October 1, 2 and 3 with the 0.60-m Zeiss telescope located at Laboratório Nacional de Astrofísica (CNPq/LNA), Brazil. Time series based on differential CCD photometry (R-band) were obtained and the usual corrections for dark and flat-field effects were aplied using tasks from IRAF. Uncertainty on each night was allways smaller than 0.01 mag. and was estimated from the standard deviation of the magnitude difference between suitable comparison stars (C1 and C2 in the finding chart). We made use of the software Period04 (Lenz and Breger 2005) for frequency analysis. The periodogram has a main peak at P = 0.037428(8) day (S/N = 70) and an additional period (in fact one harmonic at P = 0.018711(5) day, S/N = 17) was detected after prewhitening. We decided to stop the search when the resultant signal reached S/N < 10. We are working with spectroscopic data obtained in the same epoch, to confirm the periodicity and coherence of BX Scl. |
| References: |
| Breger, M., 2000, ASP Conference Series, 210, 3
Lenz, P., Breger, M., 2005, Communications in Asteroseismology, 146, 53 Preston, G.W., Landolt, A.U., 1998, Astron. J., 115, 2515 |
Light Curve
Top: Differential CCD light curve of BX Scl taken on 2007 October 03 (exp. time = 60s). Bottom: Phase diagram of BX Scl, with respect to P = 0.037428 day, considering all data. Finding Chart 
Comparison stars: C1 (GSC 6987-00728, V = 13.6) and C2 (GSC 6987-00247, V = 14.8) Data Source |