|
Peremennye Zvezdy (Variable Stars) 42, No. 3, 2022 Received 22 March; accepted 31 March. |
Article in PDF |
|
DOI: 10.24412/2221-0474-2022-42-12-16
|
PZ Mon: Influence of Spots on Radial Velocity Measurements
Yu.V. Pakhomov1, N.A. Gorynya1,2
- Institute of Astronomy of the Russian Academy of Sciences,
Pyatnitskaya str., 48, 119017 Moscow, Russia
- Sternberg Astronomical Institute, Lomonosov Moscow University, Universitetsky Ave., 13, 119992 Moscow, Russia
|
We present calculations of radial velocity corrections
along the phase curve due to influence of the spotted surface of
the active giant, PZ Mon. The maximum deviation from a relatively
uniformly-bright stellar disk is about 0.20-0.25 kms |
1. Introduction
PZ Mon is a K2III chromospherically active variable star of the
RS CVn type (Pakhomov et al., 2015). Its activity manifests itself
by the presence of cool photospheric spots and modulation of
brightness by stellar rotation that provides observable amplitude
about 0
![]() 10 in the
10 in the ![]() band with a period of
band with a period of ![]() 34
34
![]() 13.
This is a binary system with a low-mass component and an orbital
period of
13.
This is a binary system with a low-mass component and an orbital
period of ![]() 34
34
![]() 15 (Pakhomov & Gorynya, 2015). The
position of main spots responsible for variability is stable
(Pakhomov et al., 2017), they are located toward the secondary
component (Pakhomov & Gorynya, 2015). Thereby, the axial rotation
of PZ Mon and the orbital motion of the low-mass component are
synchronous.
15 (Pakhomov & Gorynya, 2015). The
position of main spots responsible for variability is stable
(Pakhomov et al., 2017), they are located toward the secondary
component (Pakhomov & Gorynya, 2015). Thereby, the axial rotation
of PZ Mon and the orbital motion of the low-mass component are
synchronous.
The radial velocity (RV) curve of PZ Mon corresponds to a circular
orbit and has the amplitude 5.4 kms![]() (Pakhomov & Gorynya, 2015).
To date, we have 75 RV measurements obtained with five
instruments, most of them (64), with the Radial Velocity Meter
(Tokovinin, 1987) installed at the Simeiz 1-m telescope of the
Crimean Astrophysical Observatory. These measurements have a
typical error about 0.2-0.3 kms
(Pakhomov & Gorynya, 2015).
To date, we have 75 RV measurements obtained with five
instruments, most of them (64), with the Radial Velocity Meter
(Tokovinin, 1987) installed at the Simeiz 1-m telescope of the
Crimean Astrophysical Observatory. These measurements have a
typical error about 0.2-0.3 kms![]() . For others spectrographs, the
accuracy is about 0.1-0.7 kms
. For others spectrographs, the
accuracy is about 0.1-0.7 kms![]() . Main observations cover more than
nine years from 2011 to 2021; we also have one RV measurement of
1989 from Saar (1998). Despite the accuracy of the data, we have a
significant scatter with respect to the theoretical RV curve
calculated as the best solution of orbital elements. The rms
deviation is 0.97 kms
. Main observations cover more than
nine years from 2011 to 2021; we also have one RV measurement of
1989 from Saar (1998). Despite the accuracy of the data, we have a
significant scatter with respect to the theoretical RV curve
calculated as the best solution of orbital elements. The rms
deviation is 0.97 kms![]() . Pakhomov & Gorynya (2018) tried to find
the third component in the system, but without success.
. Pakhomov & Gorynya (2018) tried to find
the third component in the system, but without success.
On the other hand, the RV deviations can be caused by rotation of
the spotted surface of PZ Mon. In this case, the cool spots will
contribute less to the total stellar flux, and the velocity field
of brighter areas will dominate. Therefore, there will be a shift
of the RV with respect to a uniformly bright stellar disk.
Considering that the rotation velocity of PZ Mon is 10.5 kms![]() , we
can expect noticeable shifts.
, we
can expect noticeable shifts.
In this paper, we present calculations of the RV changes during one rotation period of PZ Mon.
2. Model of PZ Mon Surface
We use a model calculated for the multiband extended Johnson
photometric system, from ![]() to
to ![]() (Pakhomov et al., 2018). The
model is a map that consists of three areas of different
temperatures: the quiet surface (
(Pakhomov et al., 2018). The
model is a map that consists of three areas of different
temperatures: the quiet surface (
![]() =4730 K,
=4730 K,
![]() 40..60% of visible stellar disk), the permanently visible
cool spotted area (
40..60% of visible stellar disk), the permanently visible
cool spotted area (
![]() =3500 K,
=3500 K, ![]() 40%), and the
warm spotted area (
40%), and the
warm spotted area (
![]() =4480 K,
=4480 K, ![]() 0..20%). This
model describes all observed features: the shape of photometric
curves in all bands, the amplitudes in all bands, the total
spectral energy distribution, the intensity of photospheric
spectral lines. The map size is 7200
0..20%). This
model describes all observed features: the shape of photometric
curves in all bands, the amplitudes in all bands, the total
spectral energy distribution, the intensity of photospheric
spectral lines. The map size is 7200![]() 3600 cells.
3600 cells.
3. Calculations
For each rotation phase, we transformed the initial map of the
stellar surface (![]() ,
, ![]() - analogues of longitude and latitude)
to the polar coordinate system (
- analogues of longitude and latitude)
to the polar coordinate system (![]() ,
, ![]() ) starting at the
star's center, where
) starting at the
star's center, where ![]() =[0 ..
=[0 .. ![]() /2] is the angle between
the directions towards the observer and towards the cell of the
stellar surface,
/2] is the angle between
the directions towards the observer and towards the cell of the
stellar surface, ![]() =[0 .. 2
=[0 .. 2![]() ] is the positional angle.
] is the positional angle.
The observed intensity of a cell with the coordinates (![]() ,
,
![]() ) is:
) is:
 |
where
 |
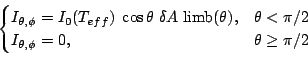
Fig. 1.
The radial velocity curve of PZ Mon due to
influence of spotted surface. Solid curve: the case of
radiation in continuum. Dashed curve: the case of the
FeI 5170 Å spectral line with |
The radial velocity of the cell is:
The radial velocity derived from the total stellar flux is intensity-weighted average:
This value of
![]() is the radial velocity of PZ Mon caused not by the real motion of the star but by the rotation of
its spotted surface. The RV during one rotation period is shown in
Fig. 1 as the solid curve. In this case, we consider radiation in
the continuum. However, actual RV measurements are based on shifts
of spectral lines. The contribution of quiet and spotted areas
will change depending on the atomic data for selected spectral
lines. Different lines have different excitation energies
is the radial velocity of PZ Mon caused not by the real motion of the star but by the rotation of
its spotted surface. The RV during one rotation period is shown in
Fig. 1 as the solid curve. In this case, we consider radiation in
the continuum. However, actual RV measurements are based on shifts
of spectral lines. The contribution of quiet and spotted areas
will change depending on the atomic data for selected spectral
lines. Different lines have different excitation energies ![]() ,
therefore, different intensities and different temperature
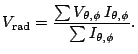
dependences. We calculated the profiles of two lines, Fe I
,
therefore, different intensities and different temperature
dependences. We calculated the profiles of two lines, Fe I
![]() =5170 Å with
=5170 Å with ![]() =6.0 eV and Fe I
=6.0 eV and Fe I ![]() =5307 Å with
=5307 Å with ![]() =1.6 eV (Fig. 2). Each final profile is composed of three
profiles calculated for corresponding temperatures (4730, 4480,
3500 K), taking into account the map of the PZ Mon surface. Shifts
of the lines with respect to laboratory wavelengths give us the RV
changes due to influence of the spotted surface and are shown in
Fig. 1.
=1.6 eV (Fig. 2). Each final profile is composed of three
profiles calculated for corresponding temperatures (4730, 4480,
3500 K), taking into account the map of the PZ Mon surface. Shifts
of the lines with respect to laboratory wavelengths give us the RV
changes due to influence of the spotted surface and are shown in
Fig. 1.
 |
Fig. 2. Theoretical profiles of FeI 5170 Å (left panel) and 5307 Å (right panel) spectral lines formed in different parts of the spotted surface of PZ Mon for phase=0.1944 with the maximal positive RV shift. |
4. Discussion
Radiation of the quiet surface dominates in the ![]() band (provides
up to 80%) due to higher temperature and larger area (Fig. 2).
The presence of warm spots significantly distorts the rotation
profile and leads to RV changes in the direction of quiet surface
motion. The cool spot does not affect the RV. Indeed, the
photometric solution requires constant area of cool spots. They
can be evenly located on the surface of PZ Mon or located at the
visible pole. In either case, this gives a symmetrical rotation
profile without a shift. Moreover, the contribution of the cool
spot is small because of its low temperature.
band (provides
up to 80%) due to higher temperature and larger area (Fig. 2).
The presence of warm spots significantly distorts the rotation
profile and leads to RV changes in the direction of quiet surface
motion. The cool spot does not affect the RV. Indeed, the
photometric solution requires constant area of cool spots. They
can be evenly located on the surface of PZ Mon or located at the
visible pole. In either case, this gives a symmetrical rotation
profile without a shift. Moreover, the contribution of the cool
spot is small because of its low temperature.
The map of PZ Mon surface was constructed from photometric data of
2017-2018. However, most of the RV measurements were obtained
between 2013 and 2019. Analysis of data from the ASAS and ASAS-SN
projects shows no change in photometric behavior. Comparison of
several epochs of accurate photometric observations (better than
![]() ) reveals some changes (Pakhomov et al., 2018, 2019) in
the maximal brightness and the amplitudes. Their main reason is
the change of cool spot's size. As seen from the above, the
influence of the cool spot on RV measurements is small. The
position of warm spots is stable, they define the shape of light
curve of PZ Mon and consequently the shape of the RV curve. Thus,
calculated RV corrections may apply for our data.
) reveals some changes (Pakhomov et al., 2018, 2019) in
the maximal brightness and the amplitudes. Their main reason is
the change of cool spot's size. As seen from the above, the
influence of the cool spot on RV measurements is small. The
position of warm spots is stable, they define the shape of light
curve of PZ Mon and consequently the shape of the RV curve. Thus,
calculated RV corrections may apply for our data.
Our calculation shows the maximal effect of 0.25 kms![]() using
spectral lines with high excitation energy. However, typical
energies of most lines are 1..4 eV; this limits the maximum of RV
changes by about 0.22 kms
using
spectral lines with high excitation energy. However, typical
energies of most lines are 1..4 eV; this limits the maximum of RV
changes by about 0.22 kms![]() . All corrected RV measurements
convolved with the period of 34
. All corrected RV measurements
convolved with the period of 34
![]() 15 are shown in Fig. 3. The
accuracy of RV measurements obtained with the Radial Velocity
Meter (RVM) is the same or better. Therefore, it is necessary to
take into account calculated RV changes to correct the RV
measurements. On the other hand, the (O-C) scatter is much larger
(0.97 kms
15 are shown in Fig. 3. The
accuracy of RV measurements obtained with the Radial Velocity
Meter (RVM) is the same or better. Therefore, it is necessary to
take into account calculated RV changes to correct the RV
measurements. On the other hand, the (O-C) scatter is much larger
(0.97 kms![]() ), which requires an explanation.
), which requires an explanation.
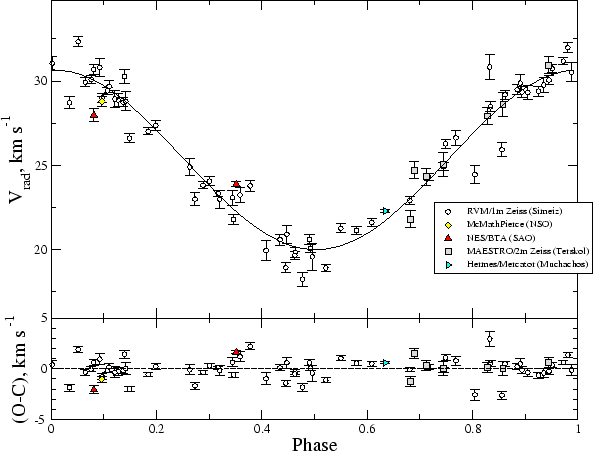 |
Fig. 3. Top: Radial velocity curve of PZ Mon corrected for influence of the spotted surface. The orbital solution is plotted as the solid curve. Bottom: Observation minis calculation (O-C) residuals. The instruments, telescopes, and observatories are identified in the legend. |
5. Conclusions
In this paper, we calculated corrections of radial velocities due
to influence of the spotted surface of the active giant PZ Mon during one rotation period. The maximal effect is about 0.25 kms![]() ,
which is comparable to the accuracy of RV measurements. This
influence is noticeable. However, the reason for large (O-C)
scatter remains open.
,
which is comparable to the accuracy of RV measurements. This
influence is noticeable. However, the reason for large (O-C)
scatter remains open.
Bibliography
Bessell, M. S., Castelli, F., & Plez, B. 1998, Astron. & Astrophys., 333, 231Pakhomov, Y. V., Antonyuk, K. A., Bondar, N. I., & Pit, N. V. 2017, in Astronomical Society of the Pacific Conference Series, 510, Stars: From Collapse to Collapse, eds. Y. Y. Balega, D. O. Kudryavtsev, I. I. Romanyuk, & I. A. Yakunin, 128
Pakhomov, Y. V., Antonyuk, K. A., Bondar', N. I., et al. 2018, Astronomy Letters, 44, 35
Pakhomov, Y. V., Chugai, N. N., Bondar', N. I., Gorynya, N. A., & Semenko, E. A. 2015, Monthly Notices Roy. Astron. Soc., 446, 56
Pakhomov, Y. V., & Gorynya, N. A. 2015, Astronomy Letters, 41, 677
Pakhomov, Y. V., & Gorynya, N. A. 2018, in A.A. Boyarchuk Memorial Conference, eds. D. V. Bisikalo & D. S. Wiebe, 62
Pakhomov, Y. V., Shenavrin, V. I., Bondar', N. I., et al. 2019, Astronomy Letters, 45, 156
Saar, S. H. 1998, Inform. Bull. Var. Stars, No. 4580, 1
Tokovinin, A. A. 1987, Soviet Astronomy, 31, 98
van Hamme, W. 1993, Astron. J., 106, 2096