|
Credit & Copyright: The Galileo Project,
NASA
Explanation:
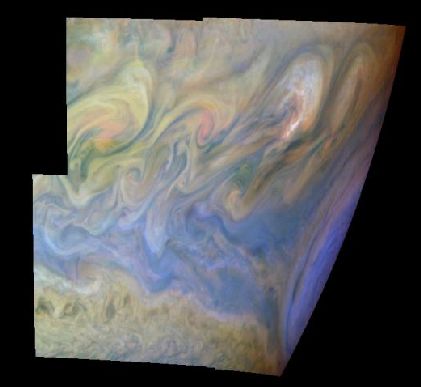
The turbulent region West of Jupiter's Great Red Spot is highlighted in
this recent picture constructed from data recorded by
the Galileo spacecraft.
The image is color coded to show
cloud height and thickness;
white clouds are high and thick, light blue clouds are high and thin, and
reddish clouds are low.
The edge of
the Red Spot itself appears blue here
(lower right) and
spans about 6,600 miles along the curving limb of the planet
(north is up).
Westward winds,
deflected north by the circulation within
the Great Red Spot, collide with
Eastward winds at higher latitudes and generate the roiling, turbulent
structures.
The largest
eddies
near the Northwestern edge of the Red Spot are
bright, suggesting upward convection and high altitude
cloud formation are taking place there.
|
January February March April May June July August September October November December |
| ||||||||||||||||||||||||||||||||||||||||||||||||
NASA Web Site Statements, Warnings, and Disclaimers
NASA Official: Jay Norris. Specific rights apply.
A service of: LHEA at NASA / GSFC
& Michigan Tech. U.
Based on Astronomy Picture
Of the Day
Publications with keywords: Jupiter - clouds - Great Red Spot
Publications with words: Jupiter - clouds - Great Red Spot
See also:
- APOD: 2025 August 17 B Asperitas Clouds Over New Zealand
- APOD: 2025 May 25 B Beneath Jupiter
- Painting with Jupiter
- APOD: 2025 April 2 B Jupiter and Ring in Infrared from Webb
- APOD: 2025 March 9 B Cyclones at Jupiters North Pole
- APOD: 2025 February 16 B Perijove 11: Passing Jupiter
- Nacreous Clouds over Sweden
